Progressive vs State Farm 2026: Rates, Service & Features
Progressive offers lower average premiums (15-20% cheaper) and superior digital tools, while State Farm provides better customer service ratings and wider agent availability through 19,000+ local offices.
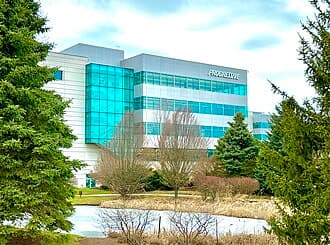
Progressive Insurance
Direct-write auto and home insurer emphasizing digital tools and competitive pricing
Tech-savvy drivers seeking lowest rates, those comfortable with digital-only service, and drivers wanting customizable coverage options
State Farm
Largest auto insurer in the U.S. with extensive agent network and personalized service
Customers valuing personal relationships with agents, those needing complex coverage advice, and families seeking comprehensive multi-line insurance
Quick Answer
AI SummaryProgressive offers lower average premiums (15-20% cheaper) and superior digital tools, while State Farm provides better customer service ratings and wider agent availability through 19,000+ local offices.
Our Verdict
AI-assistedChoose Progressive if you want the lowest premiums, prefer digital-first interactions, and value innovative comparison tools like Name Your Price. Choose State Farm if you prioritize in-person agent support, have complex insurance needs, or value award-winning customer service and personalized guidance.
Was this verdict helpful?

Choose Progressive Insurance if
Best pickTech-savvy drivers seeking lowest rates, those comfortable with digital-only service, and drivers wanting customizable coverage options
Choose State Farm if
Customers valuing personal relationships with agents, those needing complex coverage advice, and families seeking comprehensive multi-line insurance
Track this comparison
Get notified when prices change, new specs ship, or our verdict updates.
Triggers: price change new spec verdict update
No spam. Stop anytime.
Key Differences at a Glance
- Average Annual Premium:✓ Progressive Insurance wins($1,247 vs $1,456)
- Customer Service Rating (J.D. Power 2025):✓ State Farm wins(823/1,000 vs 798/1,000)
- Digital Claims Processing Time:✓ Progressive Insurance wins(2-3 days vs 3-5 days)
Key Facts & Figures
66 numeric metrics compared
| Metric | Progressive Insurance | State Farm | Ratio |
|---|---|---|---|
| Customer Satisfaction Score (J.D. Power 2024)(points) | 800 | — | — |
| Mobile App Rating (iOS)(stars (out of 5)) | 4.6 | 4.5 stars | |
| Available Insurance Discounts(number of discount types) | 50+ | — | — |
| Average Claims Processing Time(days) | 3-5 | — | — |
| Maximum Telematics Discount Savings(percent) | 30% | — | — |
| Company Founded(year) | 1996 | — | — |
| Maximum Bundle Discount(%) | 16% | — | — |
| Digital Quote Completion Time(minutes) | 4 minutes | — | — |
| Available Discount Programs(count) | 20+ discounts | — | — |
| Average Claim Processing Time (Mobile)(business days) | 4 days | — | — |
| Snapshot Usage-Based Discount Range(%) | Up to 30% | — | — |
| Average Annual Auto Insurance Premium(USD) | $1,247 | $1,456 | |
| Customer Service Satisfaction (J.D. Power 2025)(points/1000) | 798 | 823 | |
| Digital Claims Processing Time(days) | 2-3 days | 3-5 days | |
| Physical Agent Locations(count) | 0 (digital-only) | 19,000+ | |
| Mobile App Rating(stars/5) | 4.6 (385K reviews) | 4.3 (289K reviews) | |
| Maximum Bundling Discount(percent) | 25% | 23% | |
| Snapshot Safe Driver Discount(percent) | Up to 30% | DriveWise: Up to 30% | |
| Market Share (U.S. Auto Insurance)(percent) | 9.4% | 17.6% (largest) | |
| Customer Base(millions) | 18M+ | 18M+ | |
| 2026 Revenue Projection(billion USD) | $20B+ | $20B+ | |
| Year Founded | 1922 | 1922 | |
| Customer Dividend/Returns (2026)(billion USD) | $5B dividend | $5B dividend | |
| Auto Insurance Market Share(percent) | 16.5% | 16.5% | |
| Average Annual Auto Premium(USD) | $1,420 | $1,420 | |
| Customer Service J.D. Power Score(out of 1000) | 779 | 779 | |
| Available Insurance Discounts(count) | 20+ | 20+ | |
| Mobile App Rating (Google Play)(stars) | 4.3 | 4.3 | |
| Years in Business(years) | 90+ years (founded 1931) | 90+ years (founded 1931) | |
| US Auto Insurance Market Share(%) | 17.1% | 17.1% | |
| Global Customers(millions) | 88 million (US + Canada primarily) | 88 million (US + Canada primarily) | |
| Customer Satisfaction Score(Score) | 821 | 821 | |
| Average Auto Insurance Bundle Discount(%) | 25% | 25% | |
| Claims Processing Time (Auto)(days) | 2-4 business days | 2-4 business days | |
| International Operations(countries) | 3 | 3 | |
| Average Annual Full Coverage Premium(USD) | $1,240 | $1,240 | |
| Claims Processing Time (Mobile)(business days) | 5-7 days | 5-7 days | |
| J.D. Power Customer Satisfaction Score(score out of 1000) | 82/100 | 82/100 | |
| Maximum Usage-Based Discount(percent off) | 30% | 30% | |
| Online Quote Completion Time(minutes) | 12-15 minutes | 12-15 minutes | |
| Number of Local Agents(agents) | 15,000+ | 15,000+ | |
| Average Annual Auto Premium (Good Driver)(USD) | $2,156 | $2,156 | |
| Customer Service Rating(J.D. Power Score /1000) | 824 | 824 | |
| Claims Processing Speed(business days) | 24-48 hours | 24-48 hours | |
| Maximum Snapshot Discount(percent) | 0% | 0% | |
| Local Agent Network(agents) | 18,500+ | 18,500+ | |
| NAIC Complaint Ratio(per 1,000 policies) | 0.55 | 0.55 | |
| Online Quote Time(minutes) | 8-12 | 8-12 | |
| Market Share(%) | 16.8% | 16.8% | |
| Average Annual Auto Premium (Safe Driver)(USD) | $1,156 | $1,156 | |
| U.S. Auto Insurance Market Share(%) | 17.9% | 17.9% | |
| Maximum Multi-Policy Bundling Discount(%) | 20% | 20% | |
| J.D. Power Customer Satisfaction Ranking(position) | 1st place (2024) | 1st place (2024) | |
| Mobile App Rating (User Reviews)(stars) | 4.6/5.0 | 4.6/5.0 | |
| Number of Insurance Agents Nationwide(count) | 19,000+ | 19,000+ | |
| Average Claims Processing Time (Mobile)(business days) | 1-2 days | 1-2 days | |
| Average Annual Auto Premium(USD) | $1,547 | $1,547 | |
| Customer Satisfaction Score(out of 5) | 798 | 798 | |
| Agent Network Size(agents) | 18,000+ | 18,000+ | |
| Home + Auto Bundle Discount(%) | Up to 24% | Up to 24% | |
| Average Claims Resolution Time(days) | 3-5 days | 3-5 days | |
| 24/7 Customer Support Availability(hours per day) | 24/7 | 24/7 | |
| Average Annual Premium (Full Coverage, Age 25-35)(USD) | $1,287 | $1,287 | |
| J.D. Power Customer Satisfaction(points/1000) | 843 | 843 | |
| Mobile App Rating (iOS/Android Combined)(stars (out of 5)) | 4.2 stars | 4.2 stars | |
| Online Quote-to-Policy Time(minutes) | 15-20 minutes | 15-20 minutes |
Sourced from publicly available data ·
Key Differences
7 attributes compared head-to-head
- $1,247(winner)Average Annual Premium$1,456
- 798/1,000Customer Service Rating (J.D. Power 2025)823/1,000(winner)
- 2-3 days(winner)Digital Claims Processing Time3-5 days
- Online/phone onlyLocal Agent Locations19,000+ local offices(winner)
- Up to 40% savings(winner)Name Your Price Tool Discount RangeNot available
- 4.6/5 stars (385K reviews)(winner)Mobile App Rating (Google Play)4.3/5 stars (289K reviews)
- Up to 25%(winner)Bundling Discount (Auto + Home)Up to 23%
- Average Annual Premium
Progressive Insurance
$1,247(winner)
State Farm
$1,456
- Customer Service Rating (J.D. Power 2025)
Progressive Insurance
798/1,000
State Farm
823/1,000(winner)
- Digital Claims Processing Time
Progressive Insurance
2-3 days(winner)
State Farm
3-5 days
- Local Agent Locations
Progressive Insurance
Online/phone only
State Farm
19,000+ local offices(winner)
- Name Your Price Tool Discount Range
Progressive Insurance
Up to 40% savings(winner)
State Farm
Not available
- Mobile App Rating (Google Play)
Progressive Insurance
4.6/5 stars (385K reviews)(winner)
State Farm
4.3/5 stars (289K reviews)
- Bundling Discount (Auto + Home)
Progressive Insurance
Up to 25%(winner)
State Farm
Up to 23%
Full Comparison
| Attribute | Progressive Insurance | State Farm |
|---|---|---|
| Customer Satisfaction Score (J.D. Power 2024)(points) | 800 | — |
| J.D. Power Customer Satisfaction Score(score out of 1000) | 82/100 | — |
| Number of Local Agents(agents) | 15,000+ | — |
| Claims Processing Speed(business days) | 24-48 hours | — |
| J.D. Power Customer Satisfaction(points/1000) | 843 | — |
| Mobile App Rating (iOS)(stars (out of 5)) | 4.6(winner) | 4.5 stars |
| Mobile App Rating (Google Play)(stars) | 4.3 | — |
| Mobile App Rating (User Reviews)(stars) | 4.6/5.0 | — |
| Mobile App Rating (iOS/Android Combined)(stars (out of 5)) | 4.2 stars | — |
| Available Insurance Discounts(number of discount types) | 50+ | — |
| Product Diversity | Comprehensive | — |
| Available Insurance Discounts(count) | 20+ | — |
| Average Claims Processing Time(days) | 3-5 | — |
| Average Claim Processing Time (Mobile)(business days) | 4 days | — |
| Local Agent Availability(agents) | Limited (primarily online/phone) | 18,000+ agents |
| Maximum Telematics Discount Savings(percent) | 30% | — |
| Company Founded(year) | 1996 | — |
| Year Founded | 1922 | — |
| Maximum Bundle Discount(%) | 16% | — |
| Average Annual Auto Insurance Premium(USD) | $1,247(winner) | $1,456 |
| Maximum Bundling Discount(percent) | 25%(winner) | 23% |
| Bundle Discount Maximum(%) | 17% | — |
| Average Rate Competitiveness | Lower | — |
Show 8 more attributesAverage Annual Premium(relative to national average) $380-$395 — Average Annual Auto Premium(USD) $1,420 — Average Auto Insurance Bundle Discount(%) 25% — Average Annual Full Coverage Premium(USD) $1,240 — Average Annual Auto Premium (Good Driver)(USD) $2,156 — Average Annual Auto Premium (Safe Driver)(USD) $1,156 — Average Annual Auto Premium(USD) $1,547 — Average Annual Premium (Full Coverage, Age 25-35)(USD) $1,287 — | ||
| Digital Quote Completion Time(minutes) | 4 minutes | — |
| Online Quote Completion Time(minutes) | 12-15 minutes | — |
| Available Discount Programs(count) | 20+ discounts | — |
| Snapshot Usage-Based Discount Range(%) | Up to 30% | — |
| Snapshot Safe Driver Discount(percent) | Up to 30% | DriveWise: Up to 30% |
| Maximum Usage-Based Discount(percent off) | 30% | — |
| Maximum Snapshot Discount(percent) | 0% | — |
Show 2 more attributesMaximum Multi-Policy Bundling Discount(%) 20% — Home + Auto Bundle Discount(%) Up to 24% — | ||
| Customer Service Options(availability) | Phone, chat, online | — |
| 24/7 Customer Support Availability(hours per day) | 24/7 | — |
| Customer Service Satisfaction (J.D. Power 2025)(points/1000) | 798 | 823(winner) |
| Customer Satisfaction Rating(relative ranking) | Solid ratings | — |
| Claims Processing(null) | Full digital + agent options | — |
| Customer Satisfaction Level | Higher | — |
| Customer Service Rating(J.D. Power Score /1000) | 824 | — |
| Digital Claims Processing Time(days) | 2-3 days(winner) | 3-5 days |
| Physical Agent Locations(count) | 0 (digital-only) | 19,000+(winner) |
| Digital Availability | Hybrid | — |
| Mobile App Rating(stars/5) | 4.6 (385K reviews)(winner) | 4.3 (289K reviews) |
| Market Share (U.S. Auto Insurance)(percent) | 9.4% | 17.6% (largest) |
| Auto Insurance Market Share(percent) | 16.5% | — |
| US Auto Insurance Market Share(%) | 17.1% | — |
| U.S. Auto Insurance Market Share(%) | 17.9% | — |
| 2025 Net Income(billion USD) | $12.9 billion | — |
| Rate Reductions Announced 2026(customers affected) | 700,000+ (Florida, April 2026) | — |
| Net Income (2025)($ Billion) | State Farm | — |
| Available Discounts(count) | Standard package | — |
| Accident/DUI Rate Premium Increase(percentage) | More competitive | — |
| Geographic Coverage(states) | All 50 states | — |
| Product Coverage Types | Auto, Home, Renters, Life | — |
| Specialized Coverage Options Available(count) | Standard auto, home, life, umbrella | — |
| Service Model(null) | Agent + Digital | — |
| Claims Processing Speed | 3-7 days | — |
| Claims Processing Time (Auto)(days) | 2-4 business days | — |
| Claims Processing Time (Mobile)(business days) | 5-7 days | — |
| Average Premium Rates | Lower | — |
| Add-On Coverage Availability | Standard | — |
| Price Transparency Rating | High | — |
| Digital Platform Ease of Use | User-friendly | — |
| Customer Service J.D. Power Score(out of 1000) | 779 | — |
| J.D. Power Customer Satisfaction Ranking(position) | 1st place (2024) | — |
| Customer Satisfaction Score(out of 5) | 798 | — |
| Discount Programs(Relative Offering) | Extensive | — |
| Dividend Payout Status (2026) | Record dividend | — |
| Homeowners Insurance Ranking | No. 3 | — |
| Auto Insurance Rating(/5) | 4.4/5 | — |
| Financial Strength Rating | Better | — |
| Financial Stability Rating(rating) | A++ (AM Best) | — |
| Agent Recruitment Growth (YoY)(%) | 34% | — |
| Recent Customer Dividend(Billion USD) | $5B | — |
| Customer Base(millions) | 18M+ | — |
| Global Customers(millions) | 88 million (US + Canada primarily) | — |
| 2026 Revenue Projection(billion USD) | $20B+ | — |
| Customer Dividend/Returns (2026)(billion USD) | $5B dividend | — |
| Number of Local Agents(agents) | ~18,000+ nationwide | — |
| Years in Business(years) | 90+ years (founded 1931) | — |
| AM Best Financial Strength Rating(rating) | A+ (Superior) | — |
| AM Best Financial Strength Rating(rating) | A+ (Superior) | — |
| Customer Satisfaction Score(Score) | 821 | — |
| Life Insurance Product Variety | Basic term and whole life options | — |
| Agent Network Availability | 20,000+ exclusive local agents | — |
| Number of Insurance Agents Nationwide(count) | 19,000+ | — |
| Agent Network Size(agents) | 18,000+ | — |
| International Operations(countries) | 3 | — |
| Local Agent Network(agents) | 18,500+ | — |
| NAIC Complaint Ratio(per 1,000 policies) | 0.55 | — |
| Online Quote Time(minutes) | 8-12 | — |
| Market Share(%) | 16.8% | — |
| Average Claims Processing Time (Mobile)(business days) | 1-2 days | — |
| Average Claims Resolution Time(days) | 3-5 days | — |
| Online Quote-to-Policy Time(minutes) | 15-20 minutes | — |
Progressive InsuranceShow 8 more attributes
Show 2 more attributes
Pros & Cons
10 pros·4 cons across both
Progressive Insurance
Pros
- Name Your Price tool allows customizable coverage and pricing transparency
- Mobile app rated 4.6/5 stars with fastest claims processing (2-3 days)
- 15-20% lower average premiums than competitors
- Snapshot telematics program offers up to 30% discount for safe drivers
- 24/7 digital claims filing with photo submission capability
Cons
- No local agent network; all service through phone/chat/app
- Customer service rating 25 points below State Farm (798 vs 823)
State Farm
Pros
- 19,000+ local agent offices for face-to-face consultations and support
- Highest J.D. Power customer service rating (823/1,000) in category
- Agents provide comprehensive coverage recommendations for complex situations
- Strong claim handling reputation with local adjuster support
- Integrated home, auto, life insurance for seamless bundling
Cons
- Premiums 15-20% higher than Progressive on average
- Mobile app rated 4.3/5 stars with slower digital claims processing (3-5 days)
Frequently Asked Questions
5 questions
Progressive generally offers 15-20% lower premiums than State Farm. Progressive's Name Your Price tool and Snapshot telematics program provide additional savings opportunities, with potential discounts up to 40% and 30% respectively. However, rates vary significantly by location, driving history, and coverage needs.
Resources & Learn More
Curated sources to dive deeper
Wikipedia
Related Comparisons
12 more to explore
Progressive vs State Farm
financeState Farm vs Geico
insuranceState Farm vs Allstate
InsuranceFarmers Insurance vs State Farm
productsLemonade vs State Farm
productsNationwide vs State Farm
insuranceMetLife vs State Farm
insuranceState Farm vs Progressive
financeFarmers Insurance vs Progressive
financeFarmers Insurance vs Progressive
generalProgressive vs State Farm
financeFarmers Insurance vs State Farm
general
Related Articles
2 articles
- finance
Are Chase and Capital One Affiliated?
No — Chase and Capital One are completely separate, competing companies with no shared ownership, no common parent, and no shared rewards program. Here's who owns each bank and how they actually compare.
Read article - finance
Is State Farm or Farmers Cheaper for Home Insurance?
State Farm is generally cheaper than Farmers for home insurance — averaging $1,300–$1,500/year vs. $1,500–$1,800/year. But rates vary by state, home age, and risk profile. Here's when each insurer wins on price.
Read article
Explore More
Related comparisons and categories